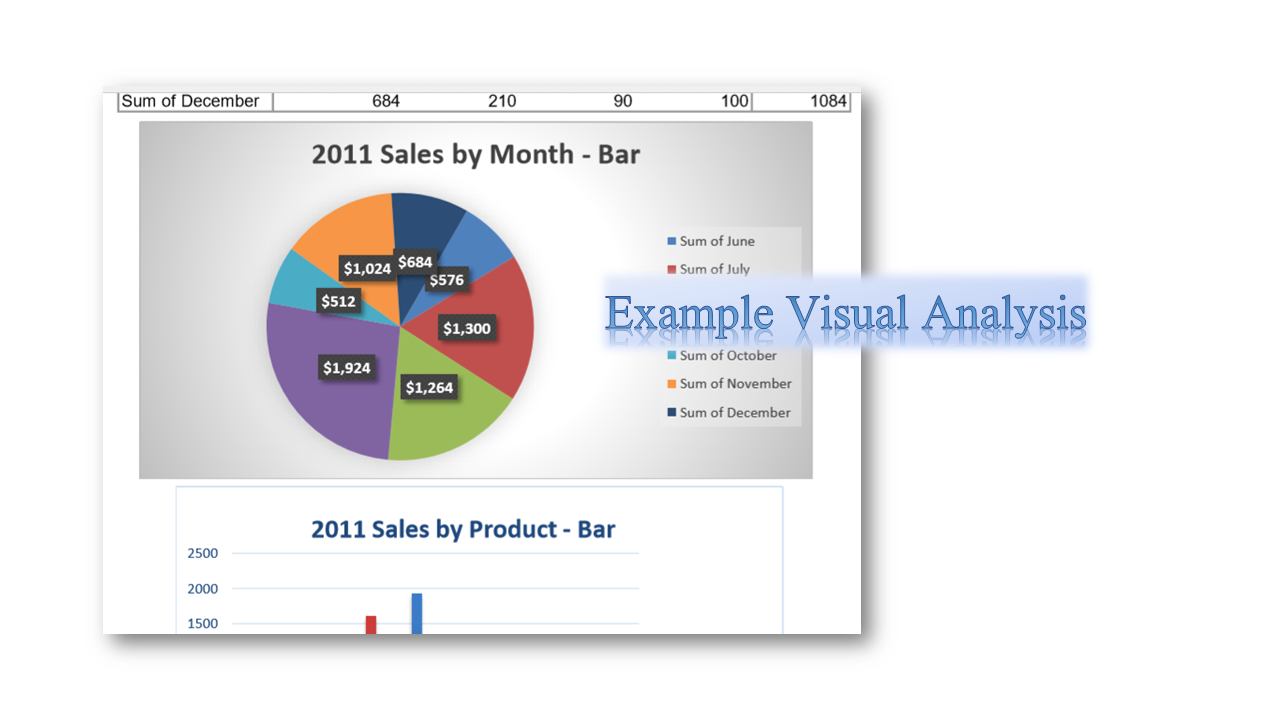
The images below were rendered using an Excel Pivot Table and Charts to illustrate the monthly cash flow of clients cafe bar to give the owner a visual of the variance of product sales during their transition from off-peak to peak tourism season.
(Actual values and company name has been changed for client confidentiality)